A slow page is easy to notice, but harder to diagnose. Chrome DevTools helps you move from “this page feels slow” to “this specific request, script, image, or layout shift is the problem.”
In this guide, I’ll show you how to use Lighthouse, Performance, Network, and Coverage to find the most common page speed issues and decide what to fix first.
How to Open Chrome DevTools
Open the page in Chrome, right-click anywhere, and select Inspect. You can also use Cmd + Option + I on Mac or Ctrl + Shift + I on Windows. For cleaner results, run tests in Incognito mode so extensions are less likely to affect the page.
Start with Lighthouse for a Baseline
Google Lighthouse is a free tool built into Chrome DevTools that helps you quickly evaluate the quality and performance of a webpage.
For site speed audits, it's usually the best place to start because it gives you a baseline report, highlights the metrics that need attention, and helps you decide where to investigate next. One of the most important parts of that report is Core Web Vitals, a set of metrics developed by Google to measure user experience.
How to run a Lighthouse report
- Open the page in Chrome Incognito Mode, right-click, and click Inspect.
- Go to the Lighthouse tab. If you don't see it, click the » icon.
- For most audits: select Performance, choose Mobile, and keep Navigation mode.
- Click Analyze page load.
Key performance metrics
The key performance metrics to look for in Lighthouse are:
- Largest Contentful Paint (LCP). When the largest visible image or text block appears in the viewport. Reflects when the main content feels loaded. Core Web Vital
- Total Blocking Time (TBT). How long the browser is blocked from responding to user input. The lab equivalent of First Input Delay (FID). Core Web Vital
- Cumulative Layout Shift (CLS). How much the page moves around while it loads. A high score usually means images, ads, fonts, and injected content are shifting the layout. Core Web Vital
- First Contentful Paint (FCP). When the first text or image appears on the screen. Shows whether the page gives users an early visual response.
Lighthouse combines these metrics into an overall performance score from 0 to 100. LCP, TBT, and CLS, the three Core Web Vitals, make up 70% of the score, so they're usually the metrics worth reviewing first.
Reading the report
Use the metrics to identify which part of the page experience needs work. Then use the rest of the report to figure out why:
- Insights group related issues into clearer themes, like LCP delays or layout shift problems, so you can see the bigger pattern behind the score.
- Diagnostics show the specific details behind those issues, including the files, elements, scripts, or caching problems that may need attention.
- The “Show audits relevant to” filter lets you narrow the report by metric, including FCP, LCP, TBT, and CLS, so you can focus on the issues affecting that metric.
Use Performance to Inspect CWVs
The Performance tab helps you troubleshoot page speed issues and see what may be hurting Core Web Vitals.
To run a report, open Chrome DevTools, go to the Performance tab, and click Record and reload to start a lab test.

After the report loads, connect field data in the right column. This lets you compare your local test with Core Web Vitals data from real users.
Lab vs. field data. Lighthouse is a lab test, so results can vary based on device settings, network throttling, browser extensions, and test conditions. Use it to diagnose likely issues, then compare against field data when available.
Review Core Web Vitals
Click the home icon in the toolbar to see your page's Core Web Vitals. From there, you can inspect each metric more closely:

- Find the LCP element: hover over the LCP element in the Largest Contentful Paint card to see which element is counted as the LCP on the page.
- Find the CLS shift area: hover over the Worst cluster in the CLS card to highlight the area of the page where layout shifts are happening.
- Test the INP interaction: interact with the page on the left to populate the INP card. Chrome will show a local INP value so you can see whether the page responds quickly.
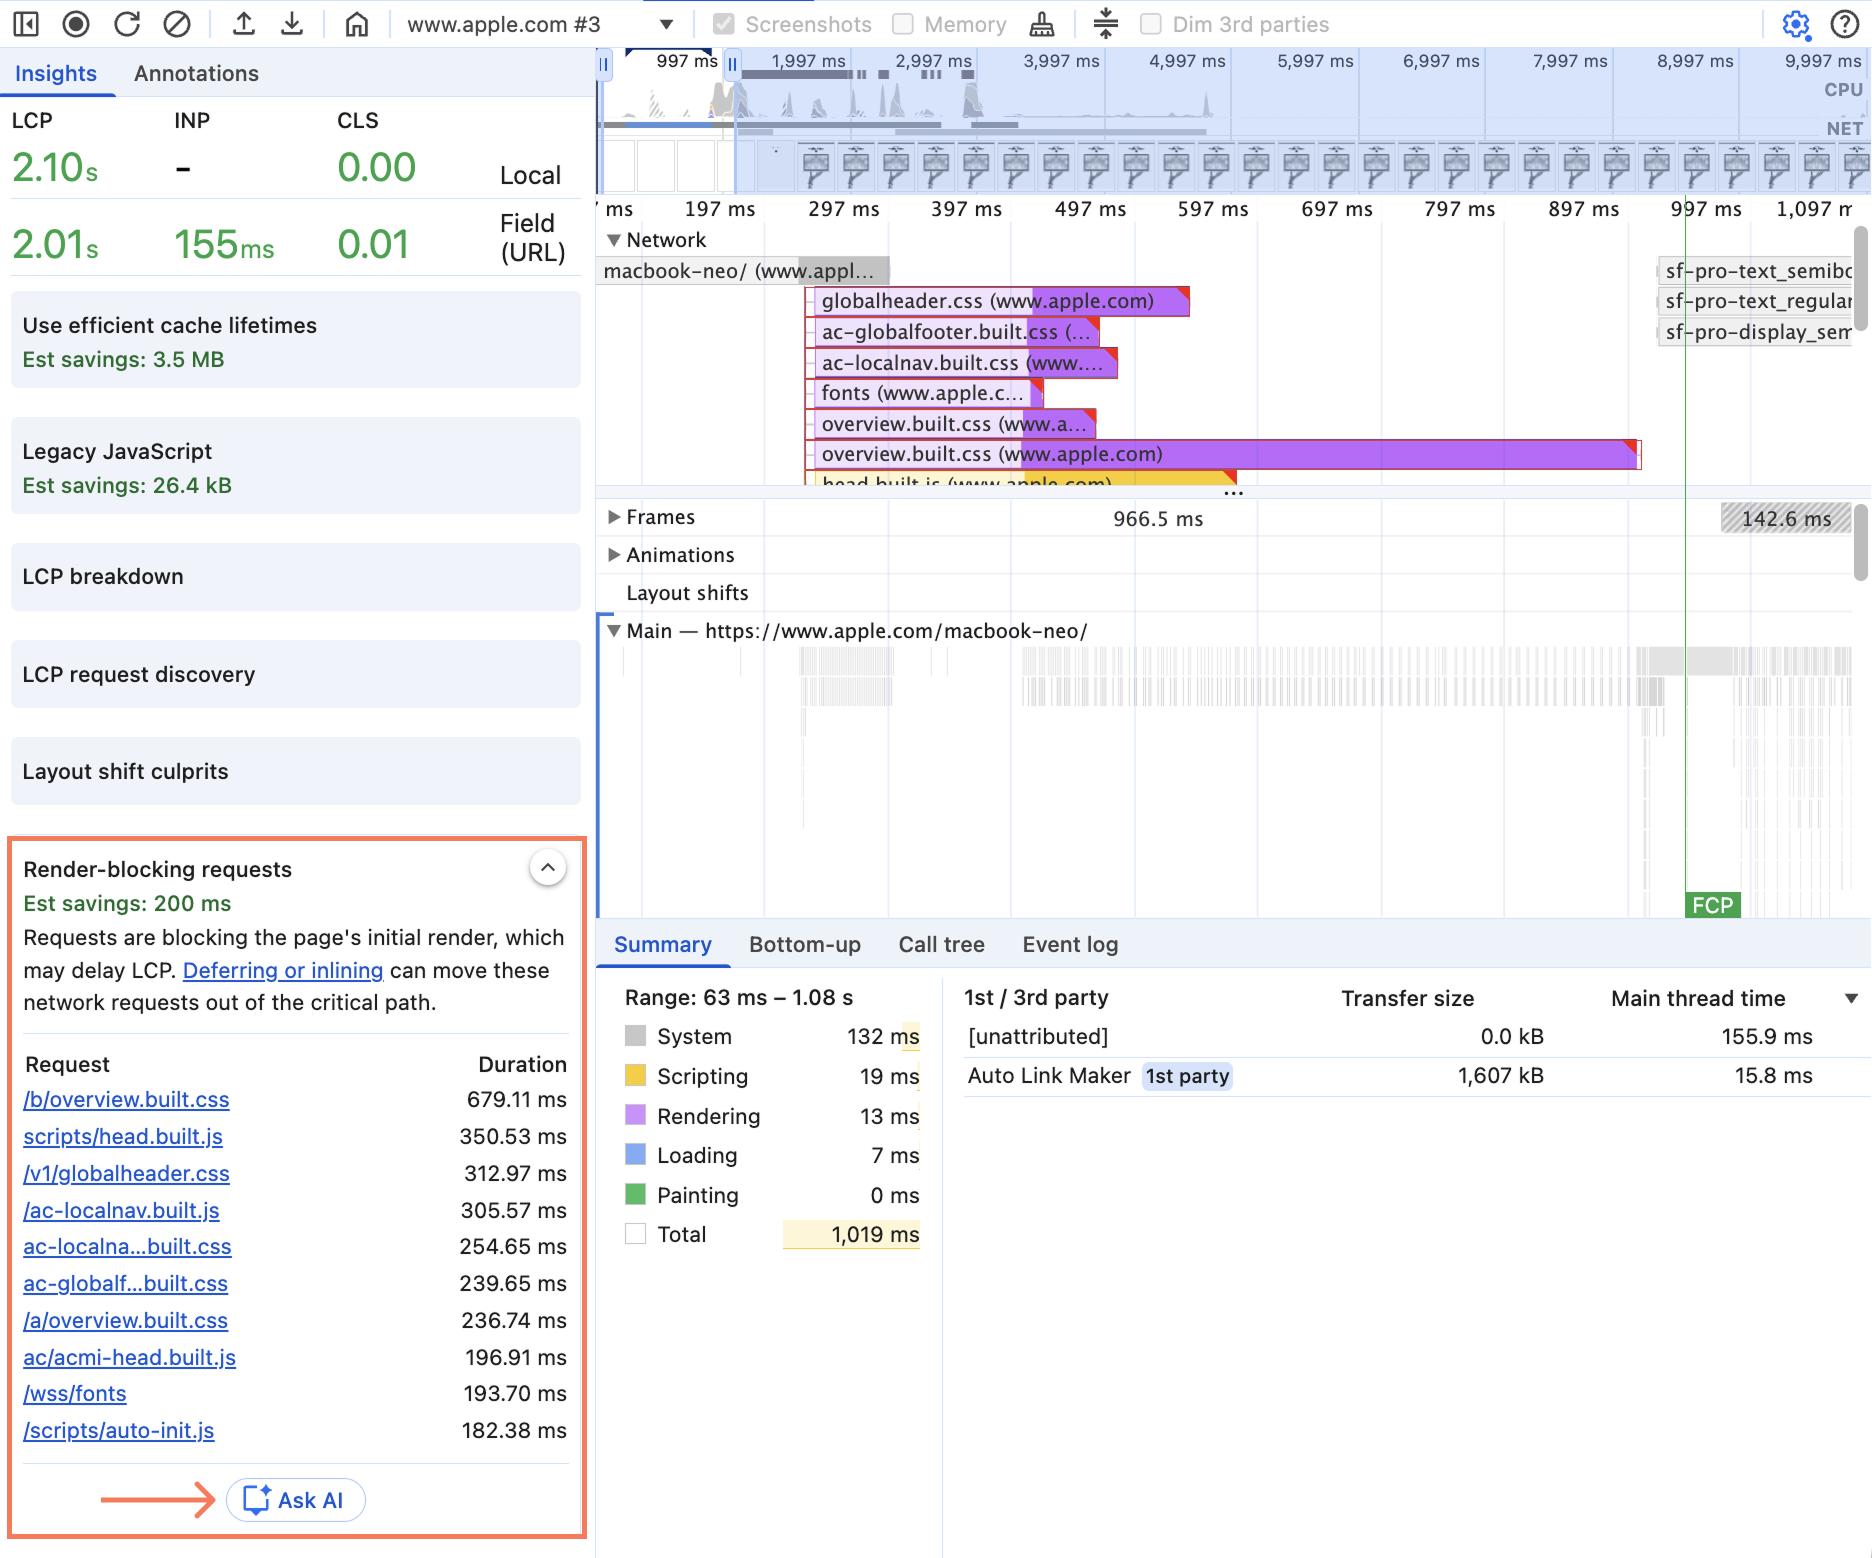
Further insights & Ask AI
Click the sidebar icon to see more detail about each issue. Then select Ask AI to better understand the problem and how to fix it.

You can ask AI anywhere in DevTools by clicking the three-dot icon and selecting Debug with AI.

To turn this on, go to DevTools Settings > AI innovations.
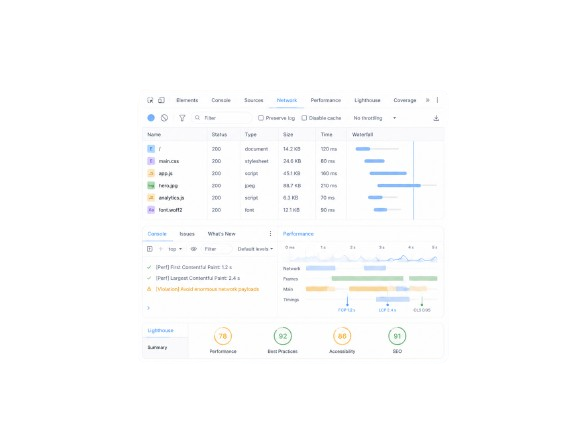
Use Network to Find Slow Requests & Heavy Files
The Network tab shows every request a page makes as it loads, including HTML, CSS, JavaScript, images, fonts, and more.
Open the Network tab and reload the page. Start with the summary at the bottom to review total requests, transferred data, resource size, finish time, DOMContentLoaded, and load time.
Then use the request table and waterfall to see what loads, how large it is, when it starts, how long it waits, and when it finishes.
Find slow requests
Check the initial HTML request first
Start with the main document request. This is usually one of the first rows in the waterfall and matches the page URL.
Look for the Waiting for server response, which represents the page's Time to First Byte (TTFB). The server is slow if that segment is long, there's a large gap before other requests begin, or key resources wait for the HTML to finish.
If the server takes too long to return the initial HTML, the rest of the page starts late.
The Gap.com request below shows a TTFB of 1,030 ms, which is worth reviewing. As a general rule, anything above 500 ms should be investigated.
Render-blocking CSS and JavaScript
After the HTML loads, check which CSS and JavaScript files load next. If large CSS or JS files appear early in the waterfall, they may delay the first render because the browser has to load and process them before the page appears.
Use the CSS and JS filters in the Network tab to find large files, scripts blocking the page load, old or unused CSS, and plugins loading globally.
The goal is to let the browser paint useful content as early as possible, even if the rest of the page continues loading.
LCP element loading too late
If Lighthouse flags a slow LCP, first find the LCP element in the Performance tab. Then open the Network tab and check where that same element starts loading in the waterfall.
A bad pattern often looks like this: the HTML loads first, then CSS, JavaScript, and other page resources load, and only after that does the LCP element start downloading.
- Find the LCP request and check the Initiator column. Parser means the browser found it in the HTML. Script means it was injected after the page started loading, which can delay LCP. This is where <link rel="preload"> can help.
Find heavy resources
Large images and oversized downloads
Images are often one of the biggest contributors to page weight. Large files can take longer to load and hurt LCP.
As a general rule, images around 300–500 KB are worth checking, 500 KB–1 MB should be investigated, and anything over 1 MB should be treated as high priority.
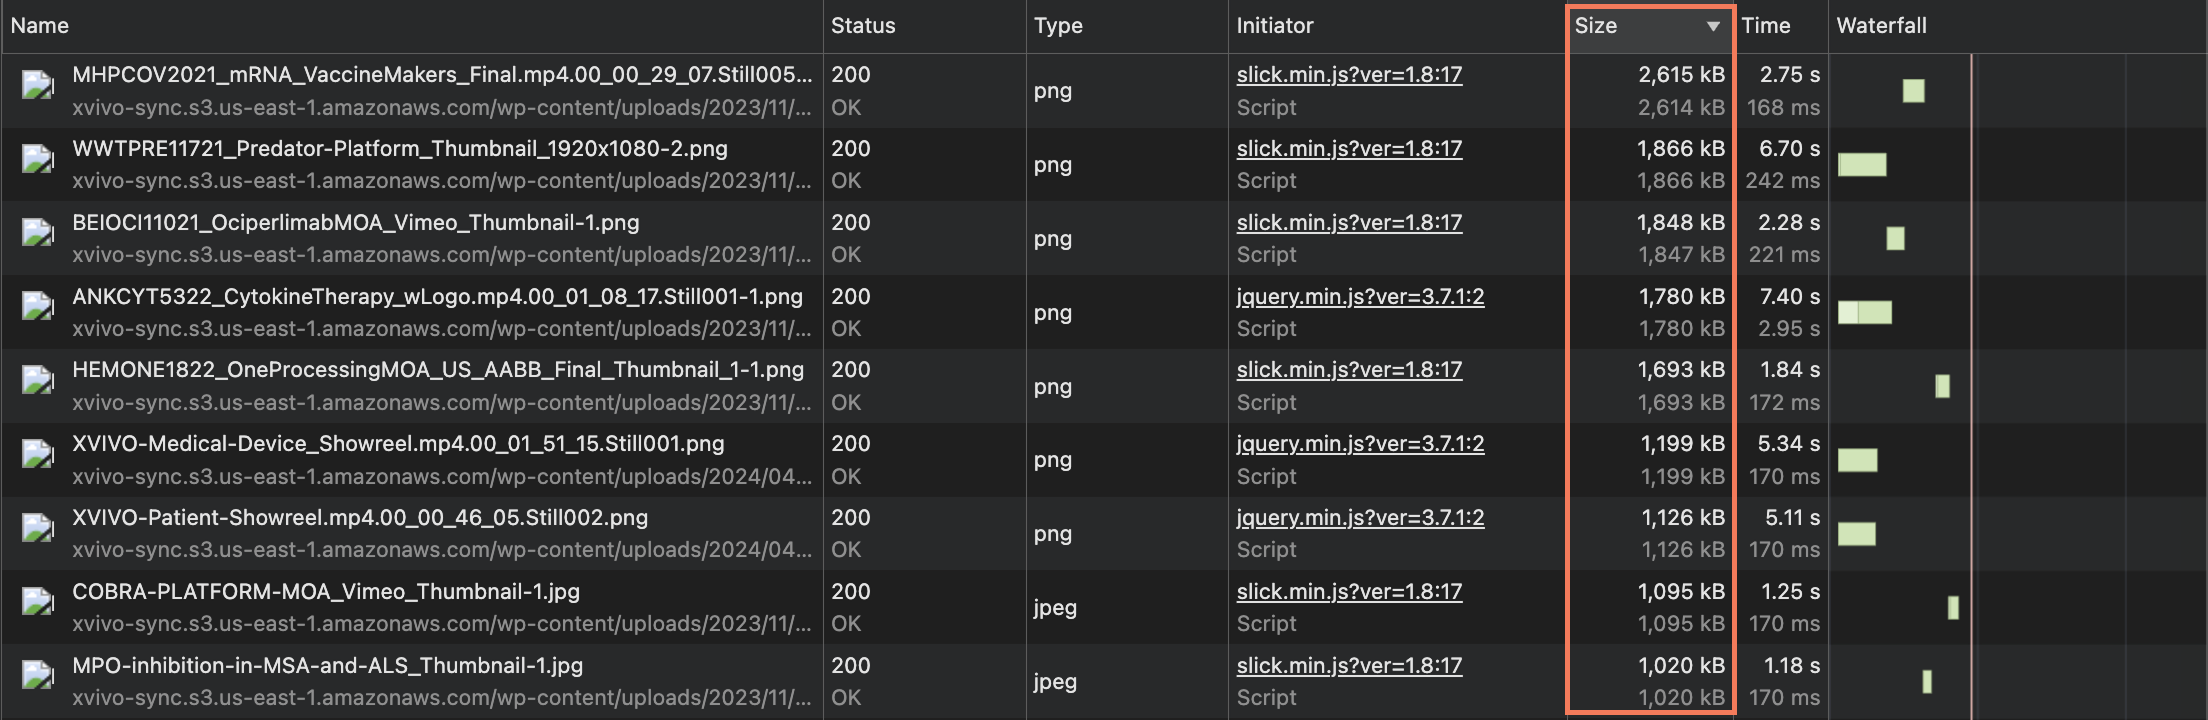
Spot oversized images via the Console. Paste this into the Console tab to list any image with more than 4× the pixel count it needs to render.
Paste into Console[...document.images]
.map(img => {
const rect = img.getBoundingClientRect();
return {
src: img.currentSrc || img.src,
natural: `${img.naturalWidth}x${img.naturalHeight}`,
rendered: `${Math.round(rect.width)}x${Math.round(rect.height)}`,
oversizeRatio: rect.width && rect.height
? Math.round((img.naturalWidth * img.naturalHeight) / (rect.width * rect.height))
: null
};
})
.filter(img => img.oversizeRatio && img.oversizeRatio > 4)
.sort((a, b) => b.oversizeRatio - a.oversizeRatio);Large JavaScript bundles
Large JavaScript files can delay both rendering and responsiveness. The browser has to download the files, then parse, compile, and run the code before the page can fully respond.
Find them the same way as large images, but filter by JS instead.
Third-party scripts
Third-party scripts are a common cause of performance problems on large websites. These are requests from outside domains, such as googletagmanager.com, assets.adobedtm.com, facebook.net, doubleclick.net, or hotjar.com.
These scripts become an issue when they affect the initial page load. Look for third-party requests that load before key resources like CSS, fonts, or the LCP image, take several hundred milliseconds to download, trigger extra requests, or come from inactive tags.
Use Coverage to Find Unused CSS & JS
The Coverage tab helps identify CSS and JavaScript that loads but is never actually used. This is extremely common on modern websites.
To open it, hit Cmd + Shift + P (Mac) or Ctrl + Shift + P (Windows) inside DevTools, search for "Coverage," then reload the page. Chrome will show the total bytes loaded, unused bytes, and percentage of unused code for each file.
Large unused JavaScript
Large unused JavaScript means the page is loading code it does not need. This can include first-party JavaScript files, third-party libraries, interaction-only scripts loaded upfront, or desktop-specific code loading on mobile.
This often happens when one large app, vendor, or design-system bundle is used across every template, even on simple pages. If a page has 500 KB+ of unused JavaScript, treat it as a high-priority issue.
Large unused CSS
Unused CSS is the stylesheet version of the same problem. It usually happens when a site loads one large global stylesheet, theme file, or design-system file across every template, even when the page only uses a small portion of it.
If unused CSS is render-blocking, the browser may delay paint while it processes styles that are not actually needed. If a page has 150 KB+ of unused CSS, treat it as a high-priority issue.
How to Fix Common Page Speed Issues
Once you know where the issue appears in DevTools, the next step is connecting it to the right fix. The sections below map common performance problems to the most likely causes, the best fixes, and the DevTools tab where you can confirm the issue.
Slow Largest Contentful Paint (LCP)
LCP issues usually come from one of four places: the server is too slow, important CSS or JavaScript is blocking the page, the LCP resource is too large, or the main content depends too much on client-side JavaScript.
- Upgrade to better hosting.
- Enable full-page caching.
- Use a CDN to serve pages closer to users.
- Reduce database strain.
- Remove avoidable redirects.
- Minify and compress CSS/JS.
- Split styles and scripts by page, template, or component.
- Inline critical above-the-fold CSS.
- Defer non-critical JavaScript.
- Remove unused CSS/JS.
- Compress large images, videos, and other files.
- Resize images properly and use srcset for different screen sizes.
- Use WebP, AVIF, or JPEG instead of PNGs for photos.
- Preload the LCP image or other critical resources.
- Don't lazy-load the LCP.
Find lazy-load issues via the Console. Paste these into the Console tab to spot above-the-fold images set to lazy-load (first snippet) and below-the-fold images that aren't (second).
Above-the-fold images set to lazy-load[...document.images]
.filter(img => {
const rect = img.getBoundingClientRect();
return rect.top < window.innerHeight && img.loading === 'lazy';
})
.map(img => ({
src: img.currentSrc || img.src,
alt: img.alt,
loading: img.loading,
top: Math.round(img.getBoundingClientRect().top)
}));[...document.images]
.filter(img => {
const rect = img.getBoundingClientRect();
return rect.top > window.innerHeight && img.loading !== 'lazy';
})
.map(img => ({
src: img.currentSrc || img.src,
alt: img.alt,
loading: img.loading || '[not set]',
top: Math.round(img.getBoundingClientRect().top)
}));- Reduce critical JavaScript.
- Avoid making key content depend entirely on JS.
- Consider server-side rendering for important pages.
On the CentralBank.com homepage, several issues stand out as contributing to the high LCP:

- Below-the-fold images load before the LCP image. The browser is spending network resources on images users cannot see yet, which delays the main above-the-fold image.
- The LCP image is a CSS background image. The browser has to download and process the CSS before it can discover the image. Use a standard <img> element with fetchpriority="high".
- The mobile image is oversized. Mobile users are downloading a 1000px image for a 430px display area. Use srcset and sizes to serve smaller images on smaller screens.
Cumulative Layout Shift (CLS) Issues
CLS issues usually come from one of three places: images without dimensions, content that loads in late, or fonts swapping after text is already visible.
- Add width and height attributes on images and videos.
- Use CSS aspect-ratio when fixed dimensions are not practical.
- Reserve space before content loads using min-height, fixed containers, or placeholders.
- Preload important fonts so they load sooner.
- Use fallback fonts that are close in size and spacing to the final font.
On GameSpot.com, several issues stand out as contributing to a poor CLS score:

- Top ad space is not reserved. When ads load above the page content, they push div#site-wrapper down and cause the page to jump. Reserve the expected ad height before the ad loads.
- Carousel and card images are missing dimensions. Many images don't include width and height in the HTML, so the browser can't reliably hold space for them before they load. Add image dimensions or use CSS aspect-ratio.
- The header and ad containers expand after load. Elements above the main content change height after the page starts loading, which pushes #site-wrapper downward. Set a min-height for those areas so the layout stays stable.
High Total Blocking Time (TBT)
TBT issues almost always come from one place: JavaScript keeping the main thread too busy to respond to user input.
- Remove unused JavaScript.
- Split JavaScript by route, template, or component.
- Break long JavaScript tasks into smaller chunks.
- Prioritize JavaScript needed for key interactions.
On NYTimes.com, large JavaScript is contributing to the high TBT:
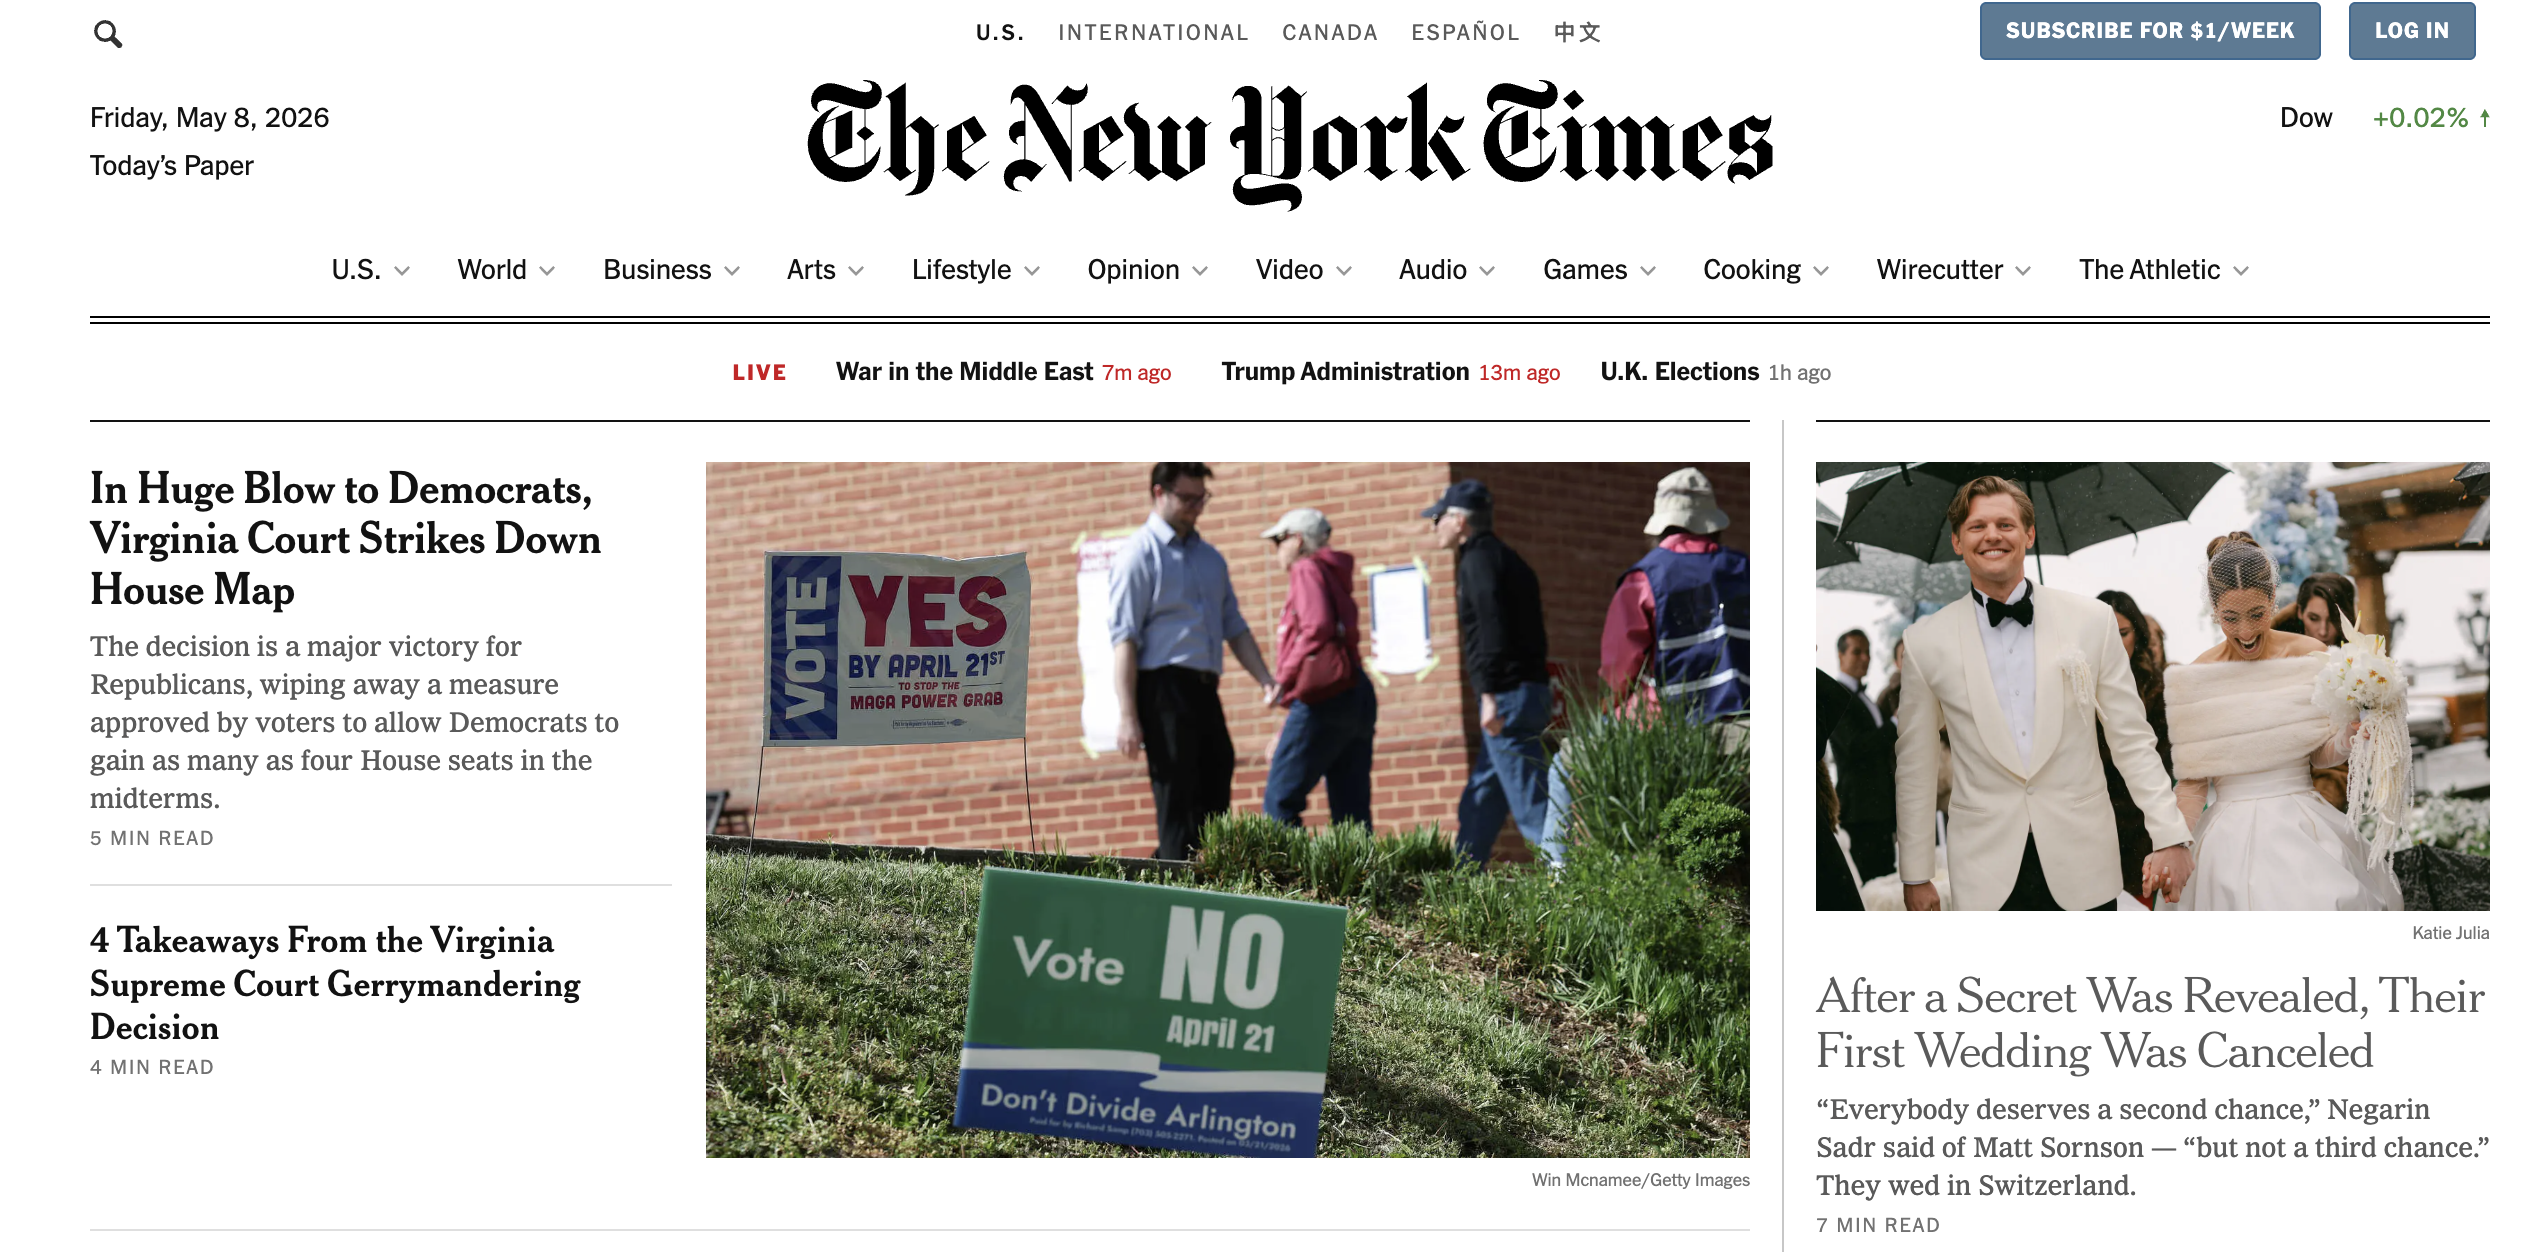
- Large JavaScript bundles are taking too long to execute. The page spends significant main-thread time evaluating large scripts, including main-7898505577c9d051fa86.js and a large vendor bundle. Break large bundles into smaller chunks and use dynamic imports so the browser only loads the JavaScript needed for the initial view.
Slow First Contentful Paint (FCP)
FCP issues usually come from CSS getting in the way: either external stylesheets blocking the page from rendering, or heavy and unused styles slowing down what the browser has to compute.
- Inline styles for above-the-fold content.
- Load non-critical CSS later.
- Reduce the number of early CSS files.
- Simplify CSS.
- Reduce complex selectors.
- Remove styles the page does not use.
On Athenahealth.com, several issues stand out as contributing to the poor FCP:

- Too many CSS files are blocking the first paint. The page loads 14 separate stylesheets early, including component-specific files like CardCarousel.css, PageTitleModule.css, and AthenaOneInAction.css. The browser has to download and parse these files before it can show content.
- Non-critical CSS is loading too soon. Styles for lower-page components, such as carousels and footer sections, appear to load before the first paint. Defer CSS that is not needed for above-the-fold content.
- Font files are adding more delay. Google Fonts stylesheets for Source Sans Pro and PT Serif add extra requests before text can render cleanly. Use font-display: swap or font-display: optional so text can appear while custom fonts load.
Wrapping up
Use Lighthouse to identify the weak metric, Performance to inspect Core Web Vitals, Network to find slow requests, and Coverage to spot unused code. Then prioritize the issues users actually feel: slow main content, layout shifts, heavy JavaScript, and unnecessary third-party scripts.
A faster site improves more than your Lighthouse score. It helps users find what they need faster and gives search engines a cleaner, more efficient site to crawl.
Need help finding and fixing the technical issues holding back your SEO performance? Let’s talk.